 ScopeFoundry
A Python platform for controlling custom laboratory experiments and visualizing scientific data
A Python platform for controlling custom laboratory experiments and visualizing scientific data
Here we discuss how to build a custom Measurement component for ScopeFoundry.
We will be describing how to build the sine_wave_plot measurement that is part of the virtual_function_gen ScopeFoundryHW package.
A ScopeFoundry Measurement is defined as a sub-class of ScopeFoundry.Measurement with a few methods (functions) defined that will describe how to setup up the measurement’s data structures (setup()) and user interface (setup_figure()) as well as functions to define the Measurement procedure (run()) and display (update_display()). We will expand on each of these functions in the next few sections.
from ScopeFoundry import Measurement

# Our measurement inherits from the ScopeFoundry Measurement class

class SineWavePlotMeasure(Measurement):

    # this is the name of the measurement that ScopeFoundry uses
    # when displaying your measurement and saving data related to it
    name = "sine_wave_plot"

    def setup(self):
        """
        Runs once during App initialization.
        This is the place to load a user interface file,
        define settings, and set up data structures.
        """

    def setup_figure(self):
        """
        Runs once during App initialization, after setup()
        This is the place to make all graphical interface initializations,
        build plots, etc.
        """

    def run(self):
        """
        Runs when measurement is started. Runs in a separate thread from GUI.
        It should not update the graphical interface directly, and should only
        focus on data acquisition.
        """

    def update_display(self):
        """
        Displays (plots) the data
        This function runs repeatedly and automatically during the measurement run.
        its update frequency is defined by self.display_update_period
        """
We add this Measurement to our MicroscopeApp by the app’s add_measurement() method:
class FancyMicroscopeApp(BaseMicroscopeApp):
    ...
    def setup(self):
        ...
        #Add Measurement components
        from ScopeFoundryHW.virtual_function_gen import SineWavePlotMeasure
        self.add_measurement(SineWavePlotMeasure(self))
        ...
setup()
run()
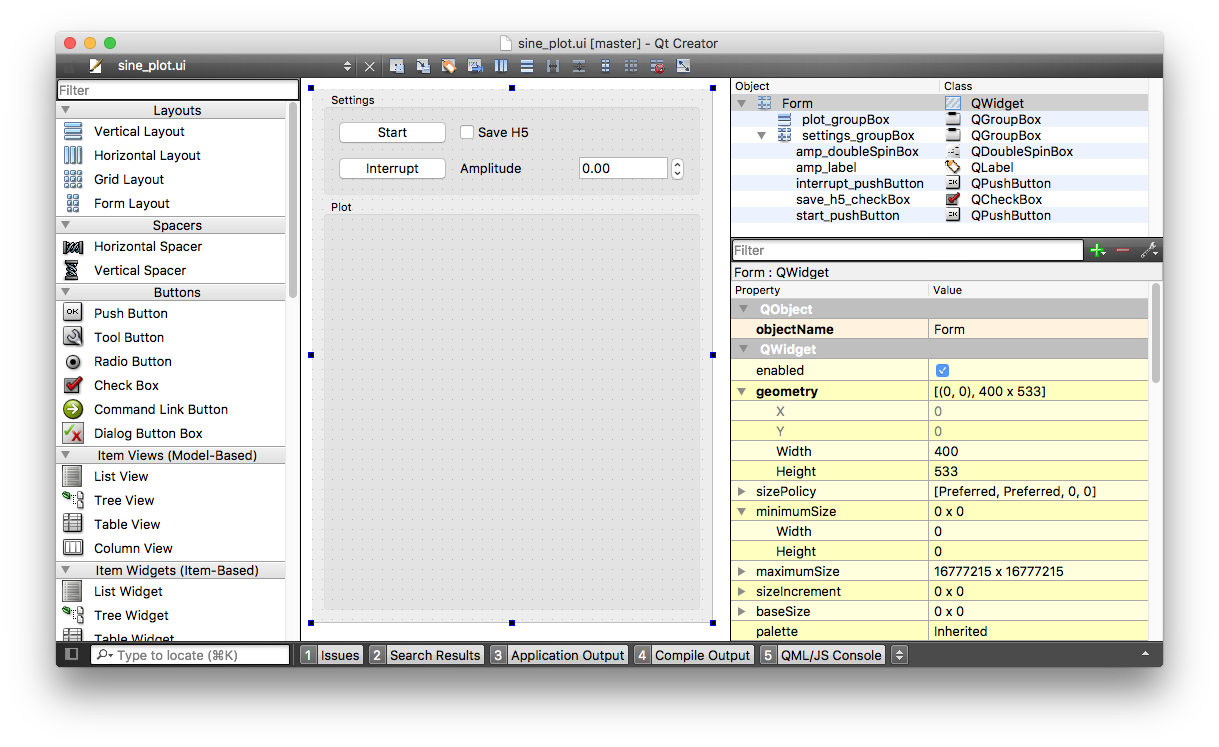
loading to setup()
setup_figure() and update_display()
    def setup_figure(self):
        ...
        # connect ui widgets to measurement/hardware settings or functions
        self.ui.start_pushButton.clicked.connect(self.start)
        self.ui.interrupt_pushButton.clicked.connect(self.interrupt)
        self.settings.save_h5.connect_to_widget(self.ui.save_h5_checkBox)
        self.func_gen.settings.amplitude.connect_to_widget(self.ui.amp_doubleSpinBox)
        ...
    def setup_figure(self):
        ...
        # Set up pyqtgraph graph_layout in the UI
        self.graph_layout=pg.GraphicsLayoutWidget()
        self.ui.plot_groupBox.layout().addWidget(self.graph_layout)

        # Create PlotItem object (a set of axes)
        self.plot = self.graph_layout.addPlot(title="Sine Wave Readout Plot")
        # Create PlotDataItem object ( a scatter plot on the axes )
        self.optimize_plot_line = self.plot.plot([0])
        ...
In order to see the data as it is aquired, an update_display() function is called repeatedly at an interval defined by self.display_update_period (in seconds). This value is set by default to 0.1 seconds, but can be updated in setup_figure().
Since we created all the plot objects during setup_figure() this update_display() function can be quite simple. Here we update the optimze_plot_line using the data in self.buffer, which is being filled by the Measurement run() thread.
    def update_display(self):
        self.optimize_plot_line.setData(self.buffer)